Microsoft 70-779 - Questions & Answers
Free preview · every answer includes a full explanation
Product page: https://prepkeys.com/70-779.html
Note: This question is part of a series of questions that present the same scenario. Each question in the series contains a unique solution that might meet the stated goals. Some question sets might have more than one correct solution, while others might not have a correct solution.
After you answer a question in this section, you will NOT be able to return to it. As a result these questions will not appear in the review screen.
You have two Microsoft SQL Server database servers named Production1 and Test1. Production1 contains the same tables as Test1, but only a subset of the data.
You add Test1 as a data source, and you select 10 tables. You configure several transformations.
You need to connect the model to the tables in Production1. The solution must maintain the existing transformations.
Solution: From Query Editor, you edit the source of each table query.
Does this meet the goal?
Your company has sales offices in several cities.
You create a table that represents the amount of sales in each city by month as shown in the exhibit.
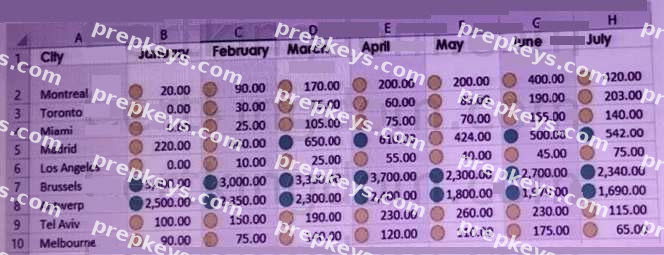
You need to ensure that all values lower than 250 display a red icon. The solution must ensure that all values greater than 500 display a green icon.
Solution: You create a measure, and then define a target value.
Does this meet the goal?
You have an Excel workbook that displays two PivotCharts. One chart displays sales by month. The other chart displays sales by year.
You add a slicer for month.
You discover that when you select a month in the slicer, the data in the sales by year PivotChart changes.
You need to prevent the slicer from affecting the sales by year PivotChart.
What should you do?
Note: This question is part of a series of questions that use the same scenario. For your convenience, the scenario is repeated in each question. Each question presents a different goal and answer choices, but the text of the scenario is the same in each question in this series.
Start of repeated scenario.
You have six workbook queries that each extracts a table from a Microsoft Azure SQL database. The tables are loaded to the data model, but the data is not loaded to any worksheets. The data model is shown in the Data Model exhibit. (Click the Exhibit button.)
Exhibit:
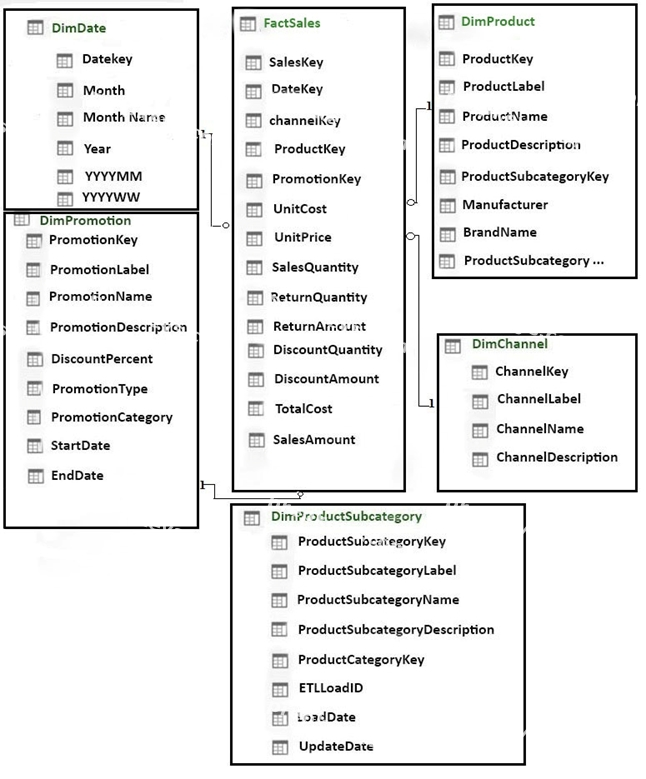
Your company has 100 product subcategories and more than 10,000 products.
End of repeated scenario.
You have a PivotChart that uses Manufacturer as the axis and the sum of SalesAmount as the values.
You need to ensure that only the top 10 manufacturers appear in the chart.
What should you do?
You have the data model shown in the exhibit. (Click the Exhibit tab.) You need to create a hierarchy from DimproductSubcategory[ProductSubcategoryName] and DimProduct[ProductName].
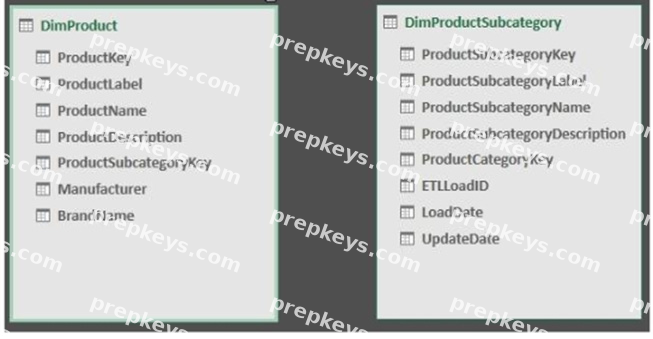
What should you do before you create the hierarchy?
You have a table in Power Pivot model that is loaded from a Microsoft SQL Server database.
The source table has four columns named ID, Price, Quantity, and Total. Total is derived by multiplying Price and Quantity. ID is a unique row identifier.
You need to minimize the amount of memory used to load the mode. The solution must ensure that you can create visualizations based on Price, Quantity, and Total.
What should you do?
You have a workbook query that loads data from a table in a Microsoft Azure SQL database. The table has a column named LineTotal. The following is a sample of the data in LineTotal:
1. 40
2. 1
3. 999
4. 7658
5. 883432
You need to ensure that when you load the data to the model, LineTotal is set as currency.
What should you do from Query Editor?
Note: This question is part of a series of questions that use the same scenario, For your convenience is repeated in each question. Each question presents a different goal and answer choices, but the text of the scenario is the same in each question in this series.
Start of repeated scenario
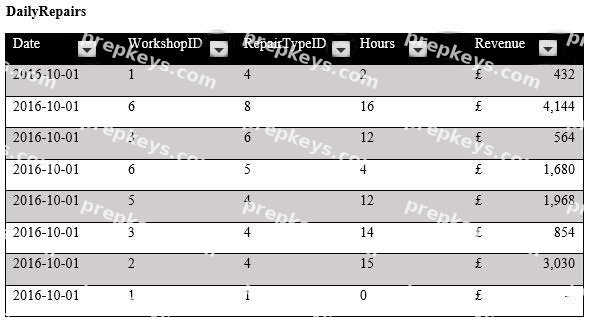
You are creating reports for a car repair company. You have four datasets in Excel spreadsheets. Four workbook queries load the datasets to a data model. A sample of the data is shown in the Data Sample exhibit.
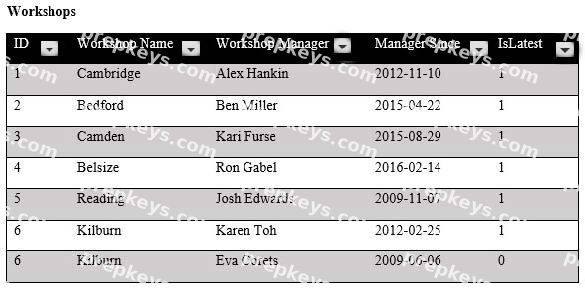
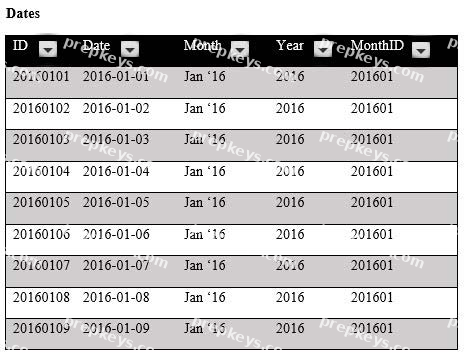
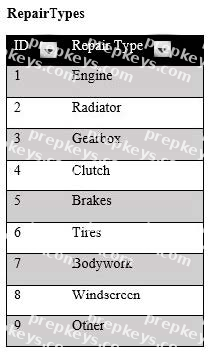
The data model is shown in the Data Model exhibit.
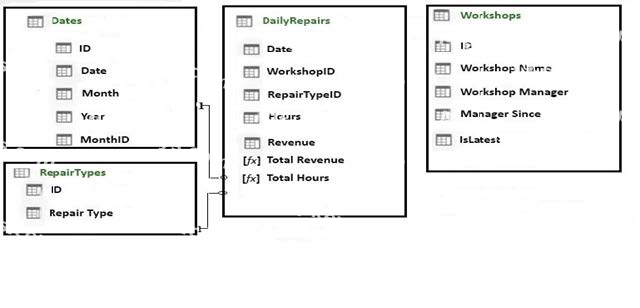
The tables in the model contain the following data:
DailyRepairs has a log of hours and revenue for each day, workshop, and repair type. Every day, a log entry is created for each workshop, even if no hours or revenue are recorded for that day. Total Hours and Total Revenue are two measures defined in DailyRepairs. Total Hours sums the Hours column, and Total Revenue sums the Revenue column.
Workshops has a list of all the workshops and the current and previous workshop managers. The format of the Workshop Manager column is always Firstname Lastname. A value of 1 in the IsLatest column indicates that the workshop manager listed in the record is the current workshop manager.
RepairTypes has a list of alt the repair types.
Dates has a list of dates from 2015 to 2018.
End of repeated scenario.
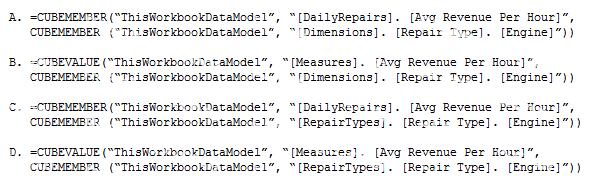
You create a measure named Average Revenue Per Hour that calculates the average revenue per hour.
You need to populate a cell in a worksheet to display the Average Revenue Per Hour where Repair Type is Engine.
Which Excel formula should you use?
You have multiple workbook queries that load data from tables in Microsoft Azure SQL Database to a Power Pivot data model.
You discover that new rows were added to the tables in Azure SQL Database.
You need to ensure that the workbook has the new data.
Why should you do?
Note: This question is part of a series of questions that use the same scenario. For your convenience, the scenario is repeated in each question. Each question presents a different goal and answer choices, but the text of the scenario is the same in each question in this series.
Start of repeated scenario.
You have six workbook queries that each extracts a table from a Microsoft Azure SQL database. The tables are loaded to the data model, but the data is not loaded to any worksheets. The data model is shown in the Data Model exhibit. (Click the Exhibit button.)
Exhibit:
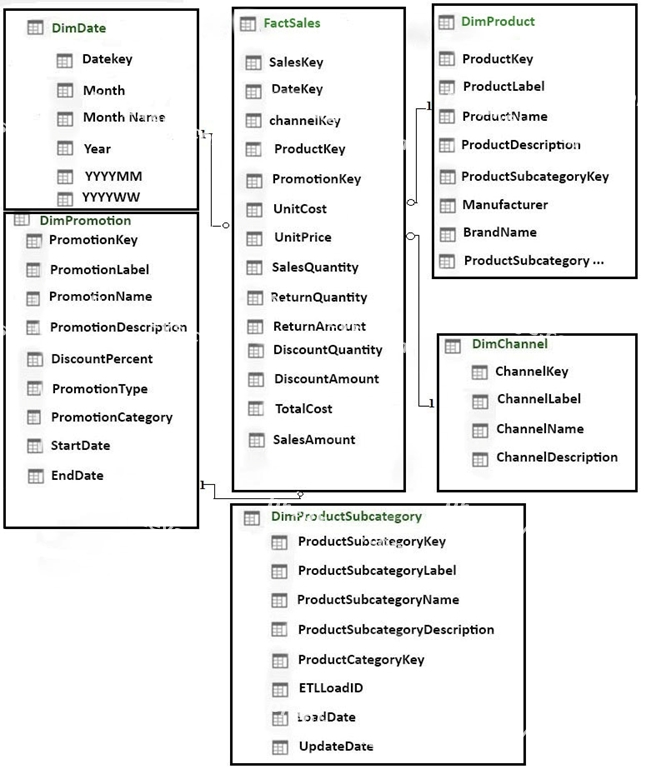
Your company has 100 product subcategories and more than 10,000 products.
End of repeated scenario.
You plan to use the DAX time intelligence functions of DATEADD and DATESMTD. You need to ensure that the functions return the correct data.
What should you do first?