IIBA CBDA - Questions & Answers
Free preview · every answer includes a full explanation
Product page: https://prepkeys.com/cbda.html
A marketing director has asked the question 'How many product purchases are expected this coming year given the current marketing campaign?".
What type of analytics would be performed to answer this question?
Insights based on the data collected indicate that a multi-national company could increase its salesof a mature product by reducing its price by 20% which would result in increased revenues of 2% over a 6- month period. The team recommends this as an appropriate goal for its organization. This is considered a good goal because:
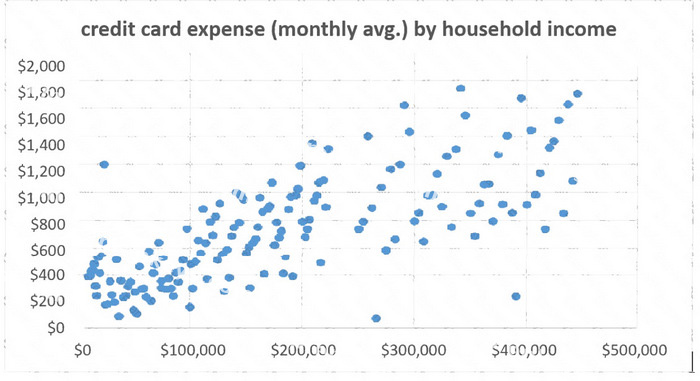
An analytics team employed at a leading credit card company is utilizing data analytics to identify unusual credit card purchases.
They have created the following visual.
How many extreme outliers exists in this dataset?
The analytics team has completed analyzing a dataset and unfortunately the data didn't deliver the kinds of insights that the team was hoping for. After much contemplation, they decide to:
An analytics team has completed some initial data analysis but is considering revising their research question based on their analysis findings. The team was concerned the original question was too broad.
What outcome would lead the team to have this concern?
A software company launched a new product in late 2016. The product manager is reviewing a Box and Whisker plot used to compare year-over-year sales, from 2017 to 2018.
What is the conclusion he can make from this chart?
As the team discusses how to utilize the results of their data analysis to put forth a business recommendation, an analyst on the team voices concern over the current organizational culture presenting a roadblock to their ability to influence business decision making.
Which of the following would be a justifiable concern at this stage of the team's efforts?
A call center has requested to review their sales conversion data for the month. The analyst working on this request is trying to identify the chart that will effectively present the data, which includes: the number of leads, the number of calls made, the number of calls completed, the number of customers interested and the number of sales.
What chart should the analyst use to show the values across each stage of the pipeline?
The architecture team puts forth a solution architecture that integrates multiple data sources from within and outside the organization. The architecture provides the foundation to source a new analytics program.
If one of the objectives of the analytics team was to provide 'one source of the truth', this objective would be referring to which of the following?
A large car manufacturer is interested in comparing the number of sales for a specific model of electric car across all 50 US states.
The data analytics team sourced and acquired the data, and the business analyst created the model to compare sales across states.
In a meeting to review the results, the feedback received included several complaints concerning an inability to distinguish the number of sales per state.
What model would result in such confusion?