Exit E20-026 Enterprise Storage Networking Specialist Exam
Question 1 of 5
0% complete
Q1 Single choice

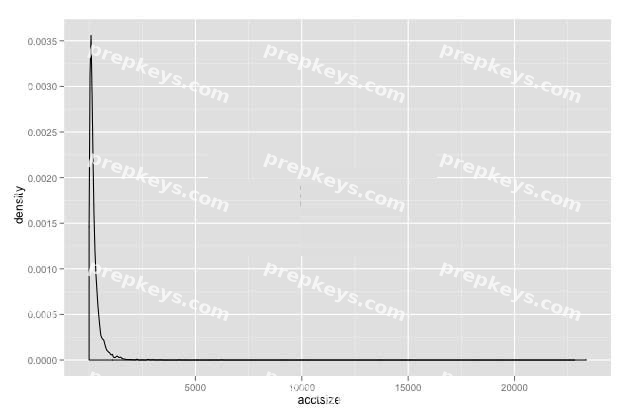
Refer to the exhibit.
You have plotted the distribution of savings account sizes for your bank.

How would you proceed, based on this distribution?
  • A

    The data is extremely skewed. Replot the data on a logarithmic scale to get a better sense of it.

  • B

    The data is extremely skewed,but looks bimodal; replot the data in the range 2,500-10,000 to be sure.

  • C

    The accounts of size greater than 2500 are rare,and probably outliers. Eliminate them from your future analysis.

  • D

    The data is extremely skewed. Split your analysis into two cohorts: accounts less than 2500,and accounts greater than 2500

Previous Next