Microsoft MO-201 - Questions & Answers
Free preview · every answer includes a full explanation
Product page: https://prepkeys.com/mo-201.html
Simulation
You work for Lucerne Publishing. You are compiling sales and royalty data for authors the company represents.
Configure Excel to disable all macros in the workbook without notification.
Simulation
On the "Plan Analysis" worksheet, modify the PivotTable to group the data by the values in the "Full Package Price" column. Group the values in steps of 100 beginning at 0 and ending at 200.
Simulation
On the "Sales Analysis" worksheet, insert a slicer that allows users to filter the PivotTable by "Category".
Then use the slicer to display only "Psychology" books.
The slicer size and position do not matter.

Simulation
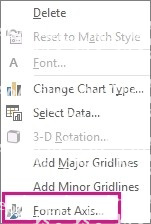
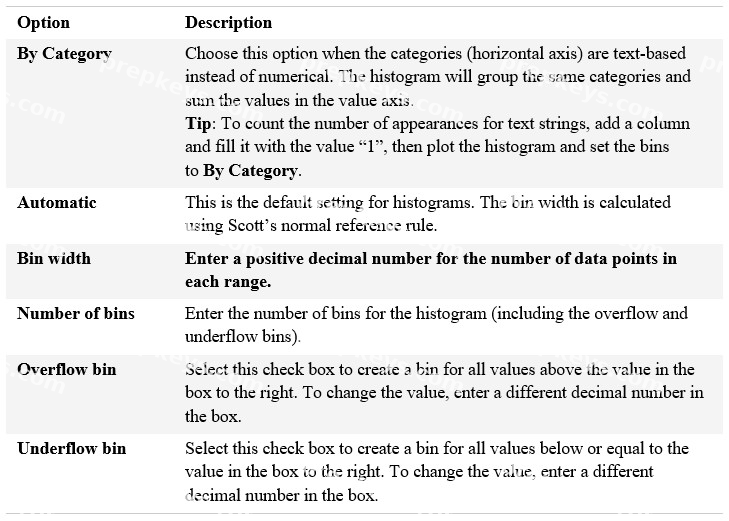
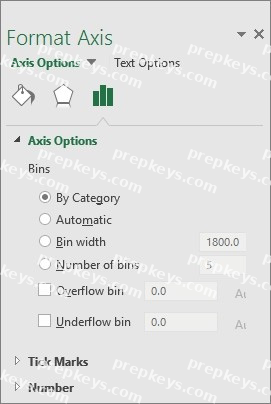
On the "New Products" worksheet, create a Histogram chart that shows the "Retail Price" of the products in bins with widths of $10.
The chart size and position do not matter.
Simulation
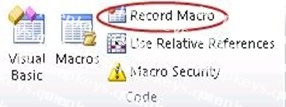
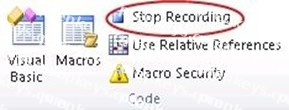
From the "Employees" worksheet, create a macro named "Header". Store the macro in the current workbook. Configure the macro to insert the "Sheet Name" in the left header cell of the active page and the "Page Number" in the right header cell.
Simulation
You are creating a product workbook for Tailspin Toys.
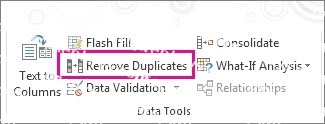
On the "Inventory" worksheet, use an Excel feature to remove the duplicate records from the "Products" cell range.
Simulation
On the "Royalty Analysis" worksheet, add the "Title ID" field as a PivotChart filter. Apply the filter to the chart to display only results for title ID "CO20".
Simulation
You are creating a workbook for the regional meeting of Southridge Video.
On the "Regional Sales" worksheet, in cells D4:F7, use the Fill Series feature to complete the sales projections using a linear growth rate of 500,000 per year.
Simulation
On the "Sales Conference" worksheet, configure cells A4:A12 to allow only whole numbers from 1 to 9.
Otherwise, display a Stop error with the title "Invalid" and the message "1 to 9".
Simulation
On the "Year-to-Date Sales" worksheet, in cells L5:L15, enter a formula that returns the average "Total Sales" for the region in cell J5 and the "Representative" in cell K5.