QlikView QSBA2024 - Questions & Answers
Free preview · every answer includes a full explanation
Product page: https://prepkeys.com/qsba2024.html
Refer to the exhibit.
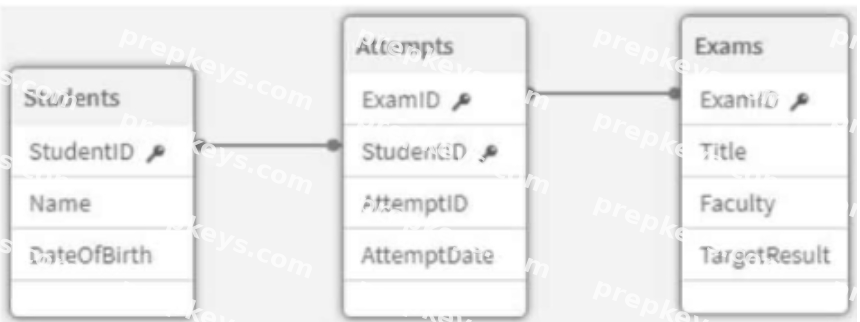
An app is being developed at a university to monitor student exam attempts-Three core tables are loaded into the app for Students, Exams, and Attempts. Students can attempt the same exam multiple times.
Before building any visualizations, the business analyst needs to know:
1. How many students are in the system
2. What percentage of students have not yet attempted an exam
Which metadata should the analyst focus on to answer these questions?
An app needs to load a few hundred rows of data from a .csv text file. The file is the result of a concatenated data dump by multiple divisions across several countries. These divisions use different internal systems and processes, which causes country names to appear differently. For example, the United States of America appears in several places as 'USA', 'U.S.A.', or 'US'.
For the country dimension to work properly in the app, the naming of countries must be standardized in the data model.
Which action should the business analyst complete to address this issue?
Refer to the exhibit.
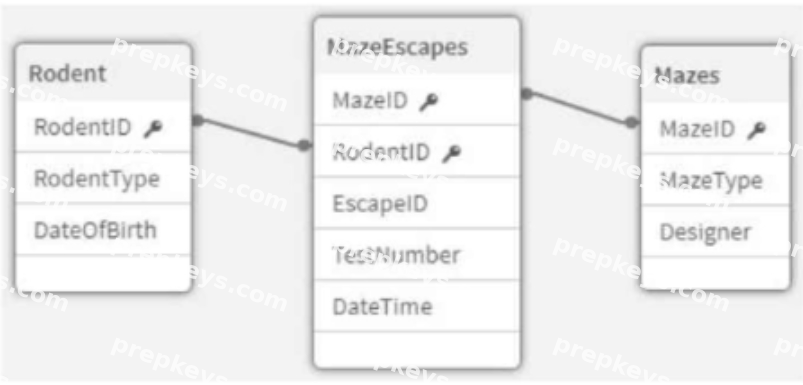
An app that will track experiments for rodents (e.g., rats and mice) that navigate mazes (labyrinths) is being developed. Individual rodents are catalogued in the Rodent table, while the Mazes table has metadata for the mazes. The MazeEscapes table holds a record of each attempt at a maze by a rodent. A business analyst needs to build a KPI that will allow users to see how many rodents have made at least one attempt at any maze.
How should the analyst construct the KPI?
A business analyst needs to create a visualization that compares two measures over time using a continuous scale that includes a range. The measures will be Profit and Revenue.
Which visualization should the business analyst use?
A business analyst is creating an app that contains a bar chart showing the top-selling product categories.
The users must be able to control the number of product categories shown.
Which action should the business analyst take?
A project management team uses an app to monitor different projects.
1. Projects may have co-dependent tasks and processes
2. Some projects include subtasks
The business analyst needs to use a diagram similar to a workflow with the processes and the sub tasks represented as boxes with lines to relate them to each other. The color of the boxes could also be determined by the status of each project or task.
Which visualization should be used?
A business analyst needs to build a chart that enables users to analyze the correlation between the following measures for all products:
1. Product Sales ($)
2. Order Volume
3. Margin%
Which visualization should the business analyst use?
A business analyst is working with retail data for consumer products. The customer is interested in the following:
1. Ability to look for outliers on sales volume and margin %
2. Ability to understand the clustering of products visually
3. Ability to see products that are above the median sales volume
Which action should the business analyst take to implement these requirements?
The human resources department needs to see a distribution of salaries broken down by department with standard deviation indicators.
Which visualization should the developer use?
A business analyst is building an app to analyze virus outbreaks. They create a bar chart using a dimension of Continent, and a measure of Sum (Knowningsections). They require a secondary bar on the chart, so they create a second measure using Count (MajorCities).
The bar chart adjusts, but no bars are visible for this second measure.
Which action should the business analyst take to resolve this issue?