Tableau TDA-C01 - Questions & Answers
Free preview · every answer includes a full explanation
Product page: https://prepkeys.com/tda-c01.html
You have a dashboard that contains confidential information about patients health. The data needs to always be up to date tor a team of healthcare workers.
How should you share me dashboard with the healthcare workers?
You want to connect a Tableau workbook to a dataset in a Microsoft Excel spreadsheet.
What should you do from Tableau Desktop?
You have a database that includes field named sales, City and Region.
You have the following chart that shows the number of sales made in different cities.
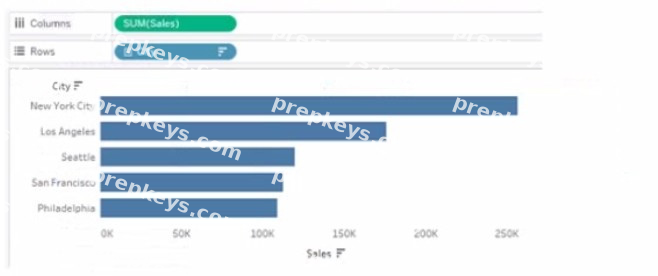
You want to dynamically show the corresponding region when users hover their mouse over any of the bars.
What should you do?
You have the following dataset.
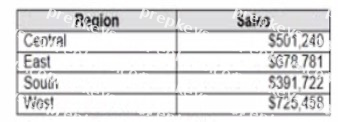
Which Level of Detail (LOD) expression should you use to calculate tie grand total of all the regions?
You have the Mowing dashboard.
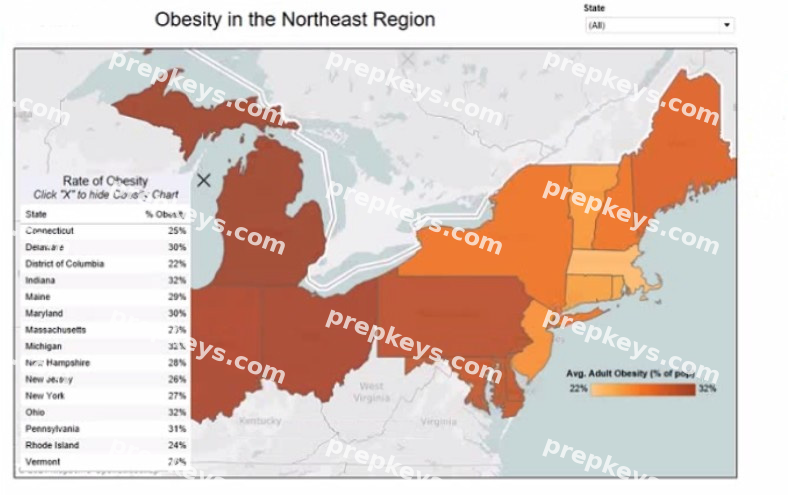
Which two elements are floating? Choose two.
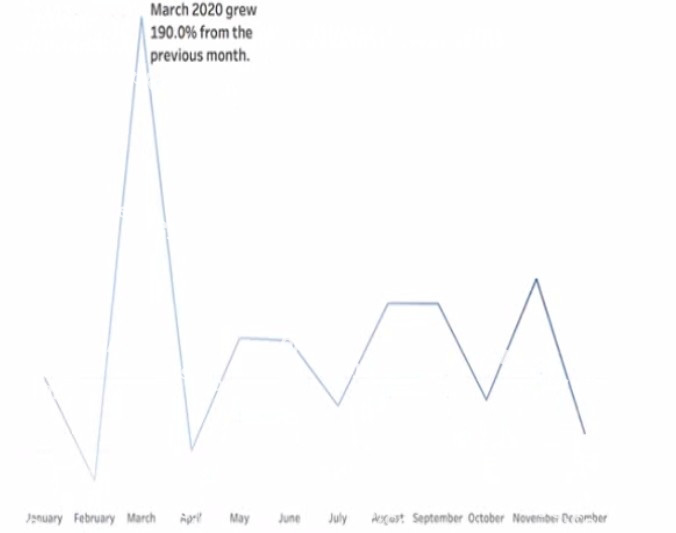
You have a line chart on a worksheet.
You want to add a comment to March 2020 as shown in the following visualization.
What should you do?
A colleague provides you with access to a folder that contains the following files:
1. Sates.csv
2. Bookl.twb
3. Sates.hyper
4. Export.mdb
Which He contains an extract?
You want to add a comment to March 2020 as shown in the following visualization.
You have the following sets in a Tableau workbook
1. Top N Customers
2. Customers of 2020
3. Top N Products
4. Sellers of 2020
Which two sets can you combine? Choose two
You have the following dashboard that contains two visualizations.
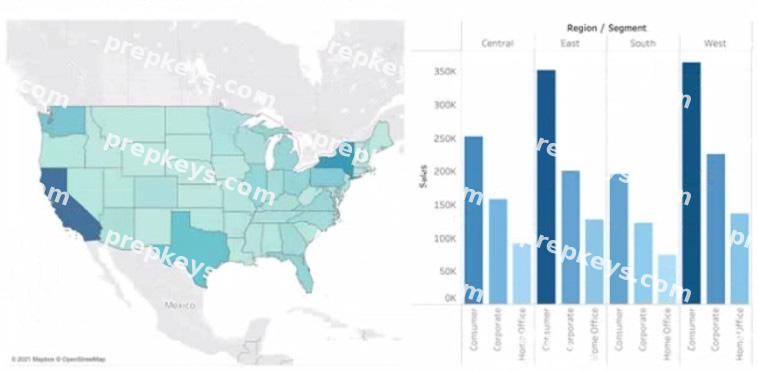
You want to show only visualization at time. Users must be able to switch between visualizations.
What should you me?
You have the following line chart that shows the average sales by month.
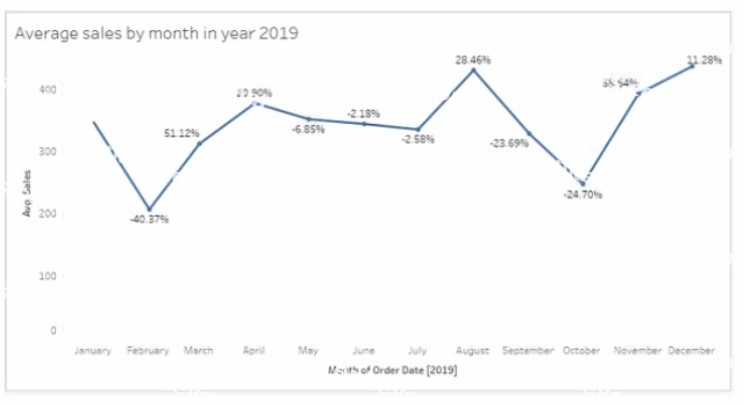
Which month had the biggest increase in swage sales compared to me previous month in 2019?