Q5
Single choice
Kevin has been asked to create a percentage bar chart that shows what percentage of project were over budget and under budget. Initially his chart looks like.
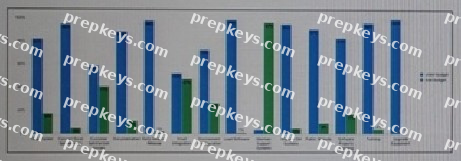
However, he wants the chart to look like.
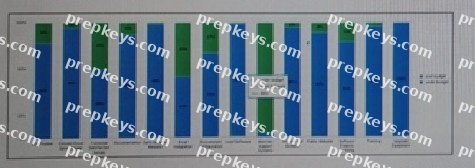
What chart attribute should Kevin change to fix this display issue?