Q1
Single choice
You work as an Office Assistant for Media Perfect Inc. You are creating a report in Microsoft Excel 2010.
The report worksheet will include the sales made by all the sales managers in the month of January.
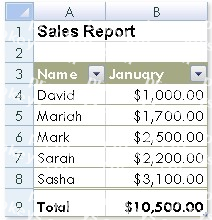
In the worksheet, you are required to place a pictorial representation displaying the percentage of total sales made by each sales manager in January.
Which of the following charts will you use to accomplish the task?