Exit C2090-621 IBM Cognos Analytics Author V11
Question 1 of 5
0% complete
Q1 Single choice

A customer wants to report the product types with the largest average revenue. In addition, the total
revenue should be shown and all product types with revenue less than three percent (>3%) in a single bar.

Targeting this result:
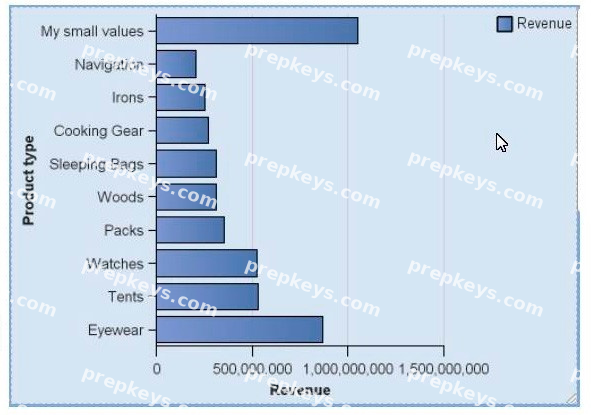
How can this be done?

  • A

    Using a visualization, because it is not possible in the default chart engine.

  • B

    Using the property "summarize small items" on the chart, the type total and setting the item label. Set the order on the default measure.

  • C

    Using the property "summarize small items" on the chart, the type average and setting the item label.
    Set the order on the chart node member.

  • D

    Writing a new query where you summarize the Product types and create a new "My small value" item based on the calculated average. Order the values in the query.

Previous Next