Q1
Single choice
You need to create a visualization of running sales totals per quarter as shown in the following exhibit.
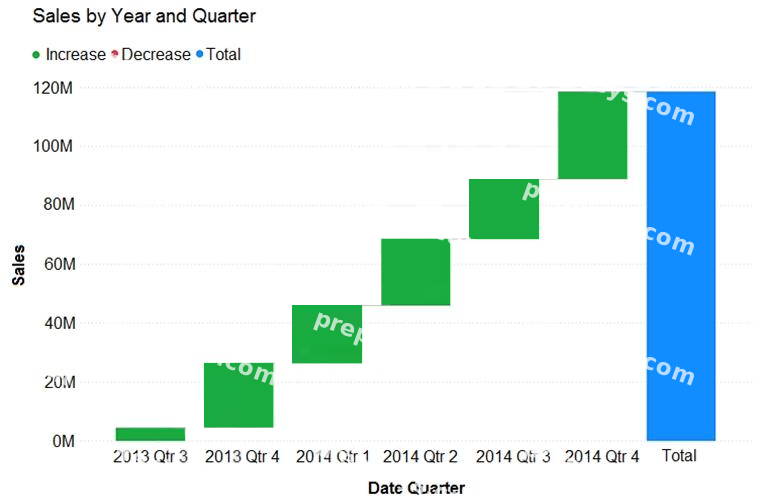
What should you create in Power BI Desktop?